CDTbot
An automated DP Caller for TDT systems


![]()
![]()
This program takes user bias out of Distorted Product Otoacoustic Emission (DPOAE) data analysis. Previously, DPOAEs were “called” by eye, with a best guess. With CDTbot, that uncertainty goes out the window. Be confident in the statistical power of your DPOAE analysis!
CDTbot is in the alpha stage, and there may be critical fails or bugs. Please email all bugs / content suggestions / improvements to CDTbotmail@gmail.com. Thank you for your help!
High Level Overview
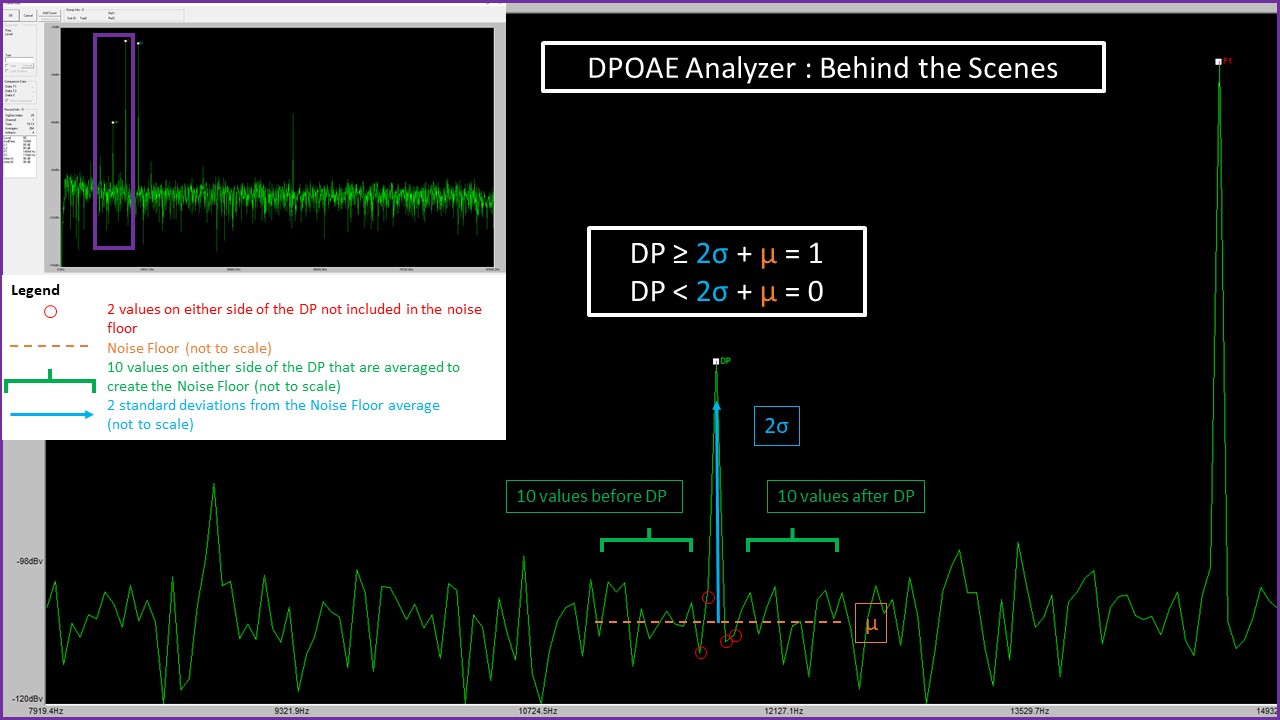
CDTbot averages the values on either side of the potential Distorted Product (DP) value to create a “noise floor.” Then, it compares the height of the DP to the noise floor, to determine statistical significance! Simply load the .csv file generated by BioSigRZ into the app, and hit “Run” to see whether the DP is significant or not for each dB/frequency combination.
One Important Note
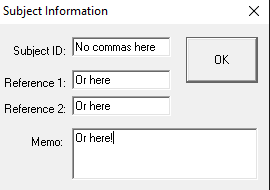
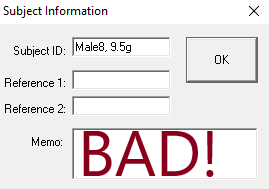
No commas can be used in the Subject ID popup window of BioSigRZ. Using commas alters the exported .csv file, leaving it unreadable by CDTbot.
Tutorial
Detailed step-by-step operations instructions, with images, can be found at:
Videos
How to Download CDTbot from Github
How to Generate .csv File in BioSigRZ
Plain Text Instructions:
- Select the desired testing signals in BioSigRZ. This can be done by selecting History > Access Record File.
- Once the BioSigRZ screen populates with the signals, select as many as you would like to analyze.
- History > Export to .csv
- Open CDTbot
- Import File > navigate to the .csv you just created. Click “Save.”
- Run!
- If you would like to save your results, select “Download” and then select a location for the program to download an .xlsx file to.
Installation
The most recent release of CDTbot can be found here.
To install, download the .zip file and open the .exe install wizard. Detailed step-by-step installation instructions can be found in the Matlab Runtime Readme.txt included in the download files. If you do not have MATLAB Runtime previously installed, expect the download to take slightly longer (~15 mins). Make sure to tick the “Create Desktop Shortcut” box for easy access.
Detailed Code Explanation
The code analyses the .csv file provided by BioSigRZ. In said .csv file, there are 2048 columns of acoustic data, going from 0 hz to 97656.3 hz. The bin size of each data column is then determined by dividing the total frequency (97656.3) by the number of columns (2048). The .csv file also gives the hz at which the DP will be located at for each frequency. That value is then divided by the bin size, and rounded to the nearest whole number, to arrive at the column of the given DP. Then, 10 values from either side of the DP, not including the 2 values directly adjacent to the DP, are averaged to create the noise floor. The standard deviation of these 20 values is also calculated. If the DP value is 2 times greater than or equal to the standard deviation above the noise floor (>= ((2*std.dev.)+ noise floor average)), then the DP is considered statistically significant, and assigned a value of 1. If this threshold is not met, the DP is not considered statistically significant, and is assigned a value of 0.
The majority of the rest of the raw code deals with GUI design, handling user input error, and fiddling with MATLAB’s labrynthine data type conversions. Raw code can be found linked below.
Known Bugs and Errors
- So far, CDTbot is PC only.
- RemoveSheet123 does not work on Mac systems. The default 3 sheets will precede the Data and Metadata sheets on Mac. Fix will be implemented when the Stanford CSBF releases the MATLAB 2019b licence to its users. Matlab 2019b does not create the default 3 sheets on Excel when using writetable() or writecell(), eliminating the need for the RemoveSheet123 function.
- Error with commas in .csv file. Right now, using commas in the description of the Subject ID of the mouse (ex. male,9.5g) alters the columns in the .csv file generated by BioSigRZ. This bug is currently being addressed.
Motivation
The Core Facilities team was pondering how to quickly and accurately determine DP when the possibility of a statistical package was tossed around. After a week of proof-of-concept testing, app development began in earnest. We are motivated to reduce user bias in DPOAE data analysis, as well as saving hard-working scientists around the world some time.
Build Status
Development Begins - November 2019
Alpha Testing - December 2019
GitHub First Commit - January 2020
Alpha Release - February 2020
Contribute
Contributions are welcome! CDTbot has a Code of Conduct that offers guidelines for how to contribute.
Generally, emailing all bugs / content suggestions / improvements to mbartho@stanford.edu is a good course of action. Thank you for your help!
Citing CDTbot
If you used this program in your research, please cite it! We would love nothing more than to see it used out in the wild.
All versions of CDTbot can be cited using its DOI as seen below. Citations for individual versions can be found in the corresponding Release notes.
Bartho et al. (2020). CDTbot: Quickly analyze the 2f1-f2 cubic difference tone distortion product. doi:10.5281/zenodo.3644403.
Source Code
Source code can be found here.
Credits
Dev Team:
Murray Bartho - Lead Developer
Patrick Atkinson, Ph.D.
Anthony Ricci, Ph.D.
Functions Used:
Noam Greenboim (2019). RemoveSheet123 - remove default Excel sheets (https://www.mathworks.com/matlabcentral/fileexchange/50371removesheet123-remove-default-excel-sheets), MATLAB Central File Exchange. Retrieved December 9, 2019.
Funding:
Stanford University School of Medicine: Department of Otolaryngology - Head & Neck Surgery
Stanford Initiative to Cure Hearing Loss (SICHL)
Acknowledgements:
MathWorks and MATLAB
Stanford Computational Services and Bioinformatics Facility (CSBF)
Licenses
MATLAB by Mathworks 2009b, 2010a and 2019a were used in the development of this application. MATLAB licensing was acquired through the academic institutional license provided by Stanford CSBF.
Adobe Illustrator CS6 was used to develop the CDTbot logo. Adobe products were provided through Stanford’s Adobe Creative Suite.
This program is protected by the MIT License, copied from Choose A License: https://choosealicense.com/licenses/mit/